Your “Margin” Might Be Fake: 7 Hidden Costs Cross-Border E-Commerce Sellers Most Often Miss

Many sellers calculate profit like this:
Selling price: 100 yuan, product cost: 40 yuan, profit: 60 yuan, margin: 60%.
If that is how you calculate it too, you are probably losing money and just have not noticed yet.
The profit structure in cross-border e-commerce is far more complex than in domestic e-commerce. There is another layer of international logistics, another layer of exchange-rate exposure, and another layer of platform rules. What really determines whether you can keep making money is often not “how much you sell for,” but whether you have included the easy-to-miss costs below.
1. Why rough margin estimates can mislead you
New sellers usually subtract only two items when calculating profit: product cost and platform commission. But between the factory and the customer, these things also happen:
- First-leg shipping moves inventory to an overseas warehouse
- The platform charges fulfillment fees based on dimensional weight or size tier, not commission
- The warehouse charges monthly storage fees based on inventory volume
- If inventory sits too long, for example more than 271 days on Amazon, you may be charged higher long-term storage fees
- You run ads, and ACOS directly eats into part of your profit
- A certain share of orders will be returned, and returns do not just reduce sales revenue; the shipping and ad spend you already paid are gone too
- If you use overseas payment collection, exchange-rate fluctuations can push your RMB costs up and down
Put together, these costs often eat up 30%-50% of your apparent margin. That is why many sellers look profitable on paper, yet find that cash has not increased by the end of the quarter.
2. The three metrics you should really watch, not just one

Most people look only at margin, but at least two other metrics matter just as much:
1. Margin Margin = Net profit ÷ Revenue × 100% This tells you how much money you keep for every 100 yuan sold. For physical-goods categories, a healthy range is usually 25%-45%. Below 20%, you have almost no buffer against higher return rates, a spike in peak-season ad costs, or exchange-rate swings. Above 50%, you likely have room to spend more on ads or compete more aggressively on price.
2. ROI (Return on Investment) ROI = Net profit ÷ Actual invested cost (purchasing + first-leg shipping + other costs) Margin shows how much you earn after a sale. ROI shows how efficiently your capital turns over. For example, a product with a high average order value may also tie up a lot of money. Its margin may look strong, but its ROI may be low, which means your cash is stuck and inventory turns are slow. If your capital is tight and you need to choose between multiple SKUs, ROI often gives better guidance than margin.
3. Break-even selling price and break-even ACOS These two numbers answer a more practical question: “How far can I cut the price, and how much can I spend on ads before I start losing money?” Knowing that boundary helps you avoid blind reactions during peak season price changes, promotions, or price pressure from competitors.
If you look at margin alone, it is easy to conclude that “this product is very profitable.” When you look at all three metrics together, you get a complete unit economics model for the product.
3. The cost checklist cross-border sellers most often undercount
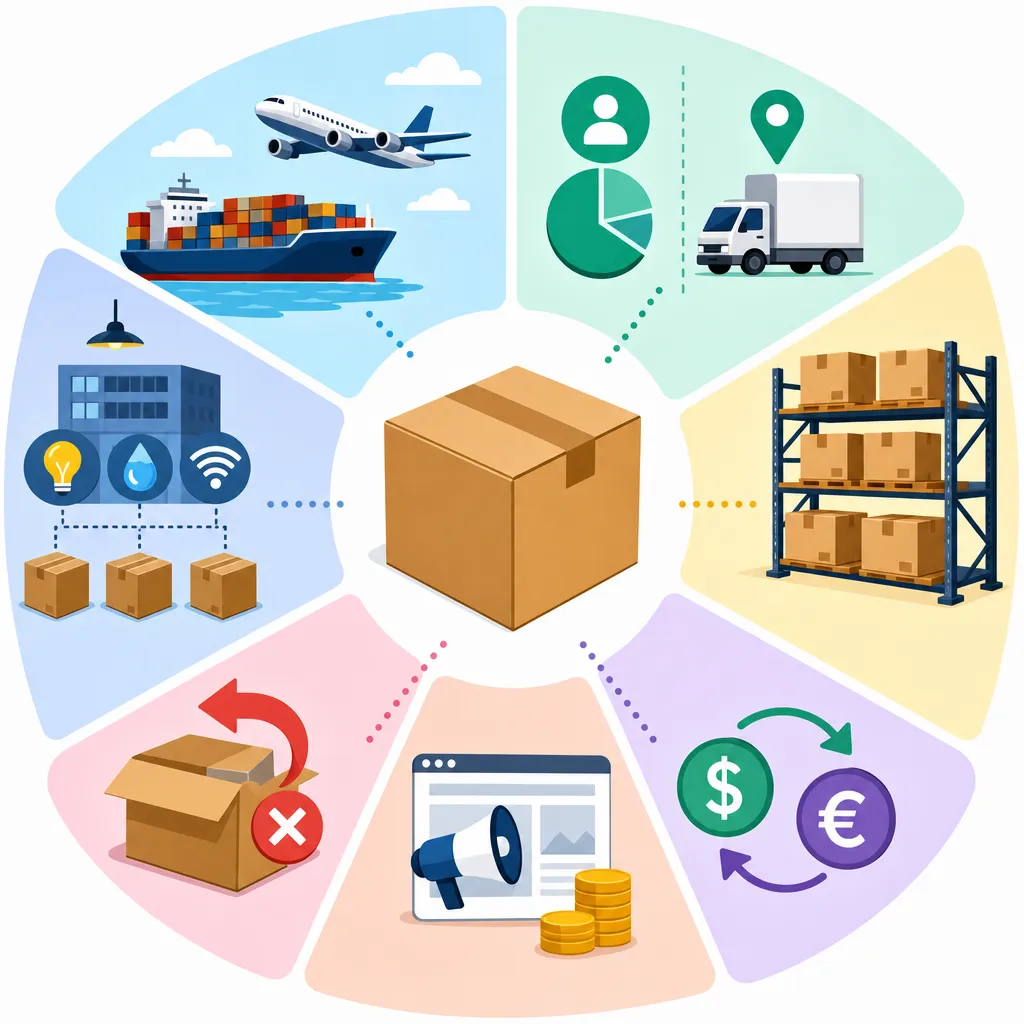
If you want to recalculate profit properly, go through the list below in this order:
- Allocated first-leg shipping cost — Allocate by carton volume and dimensional weight. Do not simply average total freight across total units. The actual allocation can vary greatly between products of different sizes.
- Calculate platform commission and fulfillment fees separately — This is the item people most often combine and miscalculate. On Amazon, for example, referral fees, typically 6%-15% depending on category, and FBA fulfillment fees are two separate charges. Fulfillment fees are determined by package size and billable weight, whichever is greater between actual weight and dimensional weight, so you cannot estimate them together.
- Storage fees — Monthly storage fees change by season, with Q4 usually costing more. Long-term storage fees kick in once inventory age exceeds the threshold. Both are easy to ignore when the bill has not arrived yet.
- Multi-currency costs and exchange rates — If your purchasing costs are settled in RMB or JPY, exchange-rate movement when converting USD revenue back into your home currency is itself a hidden profit-and-loss factor. Before placing large inventory orders, recalculate using the current exchange rate.
- Advertising ACOS — In mature categories, a reasonable ACOS is usually 15%-30%. But many sellers book ad spend separately as a “marketing expense” instead of including it in per-unit profit models. That can make profits look healthy when they are already overstretched.
- Return losses — A return is not just “one less sale.” Shipping costs, FBA processing fees, and ad acquisition costs already spent do not come back because of a return. High-return categories such as apparel and footwear need separate modeling.
- Allocated fixed costs such as the professional seller monthly subscription — These “invisible monthly fees” seem small on a per-unit basis, but when monthly sales drop, the fixed cost burden per product rises sharply.
4. Different business models have different margin benchmarks
Do not use one universal standard to judge every product line:
- Private label with brand moat: stronger pricing power, with margins often reaching 35%-50%+
- Distribution / bulk listing / arbitrage models: margins are commonly 15%-25%, relying on volume to build absolute profit
- Multi-platform listing of the same product: Amazon referral fees are 8%-15%, eBay 8%-13%, Walmart 6%-15%, and Shopify has no platform commission but does charge about 2.9% in payment processing fees. The same product can differ in actual margin by more than 10 percentage points across platforms, so one cost model cannot be used for every channel.
5. Why a “healthy product margin” can still mean the company is losing money overall

This is the part that confuses people most: the gross margin of each product looks normal, but the business still shows a loss at month-end.
The reason is simple. Product-level margin does not include fixed costs such as team salaries, software subscriptions, warehouse contracts, and labor for return handling. For example, if monthly revenue is 10,000 yuan and gross margin is 30%, gross profit is 3,000 yuan. But if fixed costs are 4,000 yuan, net loss is 1,000 yuan, even though every product appears to be “making money.”
That is why product margin alone is not enough. You also need break-even analysis to know how many units you must sell to cover fixed costs under your current cost structure.
6. How often should you recalculate profit?
Margin erosion rarely happens all at once. More often, it comes from the accumulation of small increases across several cost items: a supplier quietly raises prices by 3%, platform fees are adjusted quarterly, ad costs rise as competition intensifies, or exchange rates move slightly. Each one may look minor on its own, but together they can push you from “healthy” to “loss-making.”
A practical recalculation rhythm:
- Supplier quotes change, freight is adjusted, or platform fees change — recalculate immediately
- Ad costs or selling price change by more than 5% — recalculate immediately
- Routine operations — review once a month, at minimum once per quarter
Final note
In cross-border e-commerce, profit is never as simple as “selling price minus cost.” It is a dynamic model that includes logistics, platform rules, exchange rates, returns, and advertising. Building that model before you launch a product is far cheaper than discovering after inventory reaches the warehouse that the margin does not work. At that point, you have very little room left to adjust.
If you want to apply this framework to a specific product and do not want to build Excel formulas by hand every time, Niceggie’s Profit Calculator can pull selling prices and fees automatically by ASIN or Amazon link. It also supports manual input for all variables and calculates break-even selling price and break-even ACOS. Used together with the Break-Even Calculator and FX Impact on Profit Calculator, it covers most of the calculation scenarios mentioned above. The specific tool matters less than the habit: calculate the full profit model clearly before you list the product.