The Final Two Weeks for Black Friday Inventory: Which Order Should You Place First?

Only Two or Three Weeks Until the Black Friday Inbound Deadline
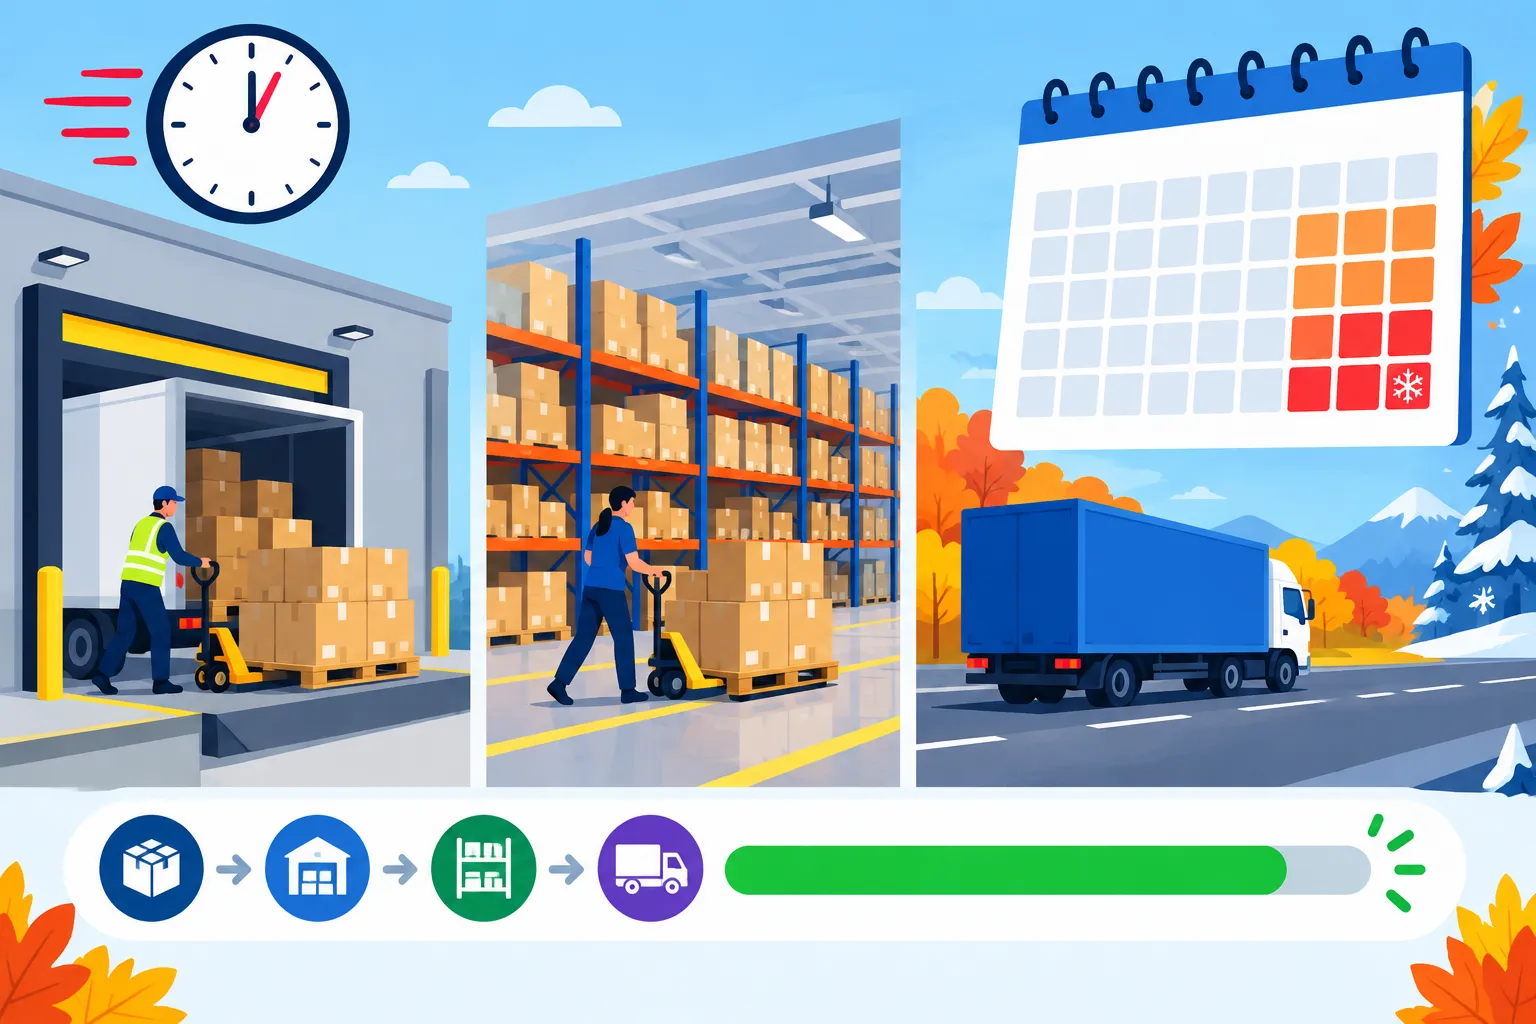
Today is October 7. According to Amazon’s 2026 holiday-season schedule released in July, the Black Friday and Cyber Monday inbound deadlines are close: shipments using AWD must arrive at the warehouse by October 14, FBA shipments using “Minimal Shipment Splits” must arrive by October 21, and those using “Amazon-Optimized Shipment Splits” must arrive by October 28.
At the same time, peak-season fulfillment fees take effect on October 15 and remain in place through January 14, 2027. The average increase is $0.32 per unit compared with the regular season, unchanged from 2025. On top of that, a 3.5% fuel and logistics surcharge that took effect for FBA fulfillment fees in April will also apply.
The fee table may look unchanged, but for most sellers, the pressure comes from the schedule rather than the rates themselves. After accounting for first-mile transit and inbound processing queues, the actual window for making the final inventory decision is only about two weeks.
Plenty of Candidates, but the Numbers Stop Adding Up When It Is Time to Order
The links saved on 1688, supplier quote PDFs, and several products calculated in a spreadsheet last month are scattered across three Excel files, two WeChat groups, and browser bookmarks. When it is time to make a decision, you open one of the spreadsheets and discover that some “landed cost” figures include first-mile shipping while others do not; some commissions are set at 15%, others at 8%; and the standing desk is still using regular-season fulfillment fees.
The next steps often look like this:
- Ranking becomes meaningless. The assumptions are inconsistent within the same spreadsheet. The product that appears to have a 20% profit margin may simply be missing return-related costs.
- Status depends on memory. You have to scroll through hundreds of messages to confirm which product has been sampled, which is still waiting for a supplier quote, and which was rejected last week.
- The final order is based on intuition. You tie up cash in the product with the thinnest margin, while failing to stock enough of the product that actually sells. By the time you replenish in December, inbound appointment schedules and peak-season fees are already working against you.
Do Three Small Things Before Placing an Order
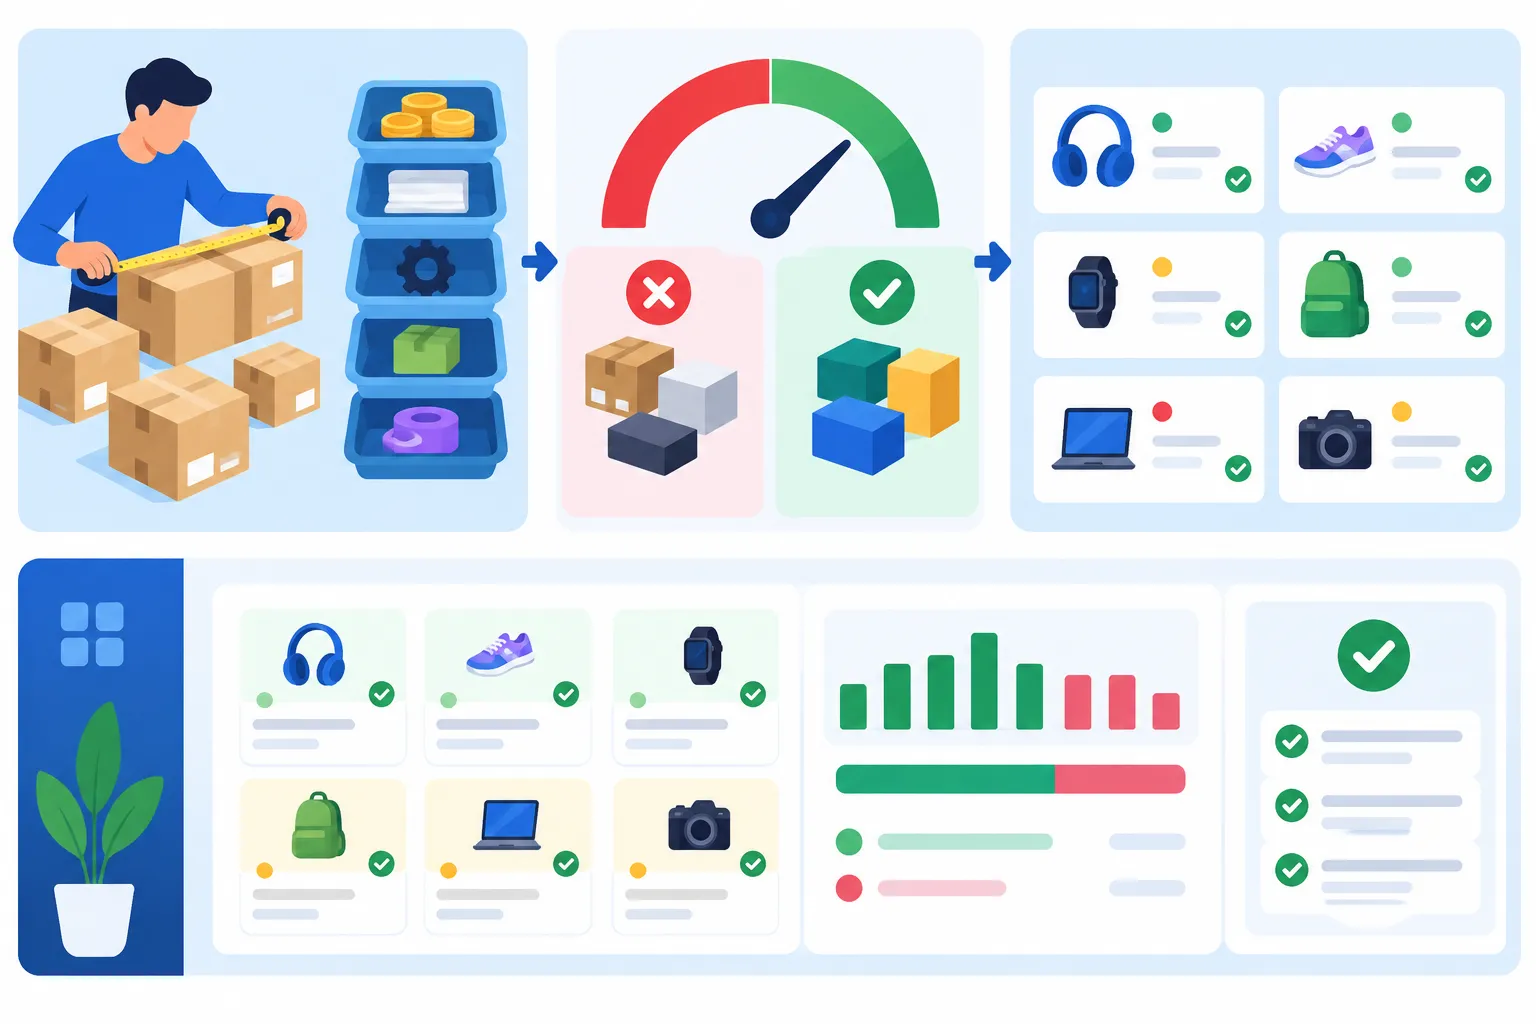
You do not need a complex model. Completing these three steps before making a final decision can eliminate most intuition-driven choices.
- Use consistent cost definitions. Break every candidate product into the same cost categories: purchase price, first-mile shipping, commissions, advertising, returns, FBA fulfillment and storage, and other costs. For orders fulfilled from October 15 onward, recalculate fulfillment fees using peak-season rates and the surcharge.
- Set a profit-margin threshold first. For example, use 30%: products above the threshold move into the ordering discussion; products between 15% and 30% need a review for possible price increases or cost reductions; products below 15% should be put aside unless there is a clear strategic reason to proceed. The right threshold depends on the category and business model. The key is to set the standard before comparing products, rather than finding reasons afterward.
- Assign a status to every product. Use statuses such as To Evaluate, Price Confirmed, Ready to Order, Ordered, and Abandoned. Statuses are more useful than notes because you can filter and count them, and someone else can understand the list without additional context.
If you also plan to run Black Friday promotions, calculate two more figures: the break-even selling price, which shows how far you can discount, and the break-even ACOS, which shows the maximum amount you can spend on advertising. These figures determine how much room a product has during the peak season.
Put All Three Steps into One List

Before writing this article, we ran the process above using our own Procurement List. The list includes three sample products, with a target profit margin of 30%:
| Sample Product | Selling Price (USD) | Landed Cost (USD) | Net Profit per Unit (USD) | Profit Margin | Distance from 30% Target | Break-even Selling Price (USD) |
|---|---|---|---|---|---|---|
| 15.6-inch Portable Monitor | 129.99 | 83.38 | 46.61 | 35.9% | +5.9 | 73.14 |
| Desktop Air Purifier | 89.99 | 72.43 | 17.56 | 19.5% | -10.5 | 68.31 |
| Dual-Motor Standing Desk | 329.99 | 308.33 | 21.66 | 6.6% | -23.4 | 302.57 |
Note: The data above is built-in demo data from the tool and is provided for illustration only. It does not represent actual profit levels for these product categories.
Looking at the products together reveals an easy-to-miss point: the standing desk’s net profit per unit ($21.66) is higher than the air purifier’s ($17.56). If you rank products only by profit per unit, the standing desk comes first. However, its profit margin is just 6.6%, and its break-even selling price is only about $27 below the current price. A small Black Friday discount could turn a profitable order into a loss. When you select several products for side-by-side comparison, costs are split into separate rows for purchase price, shipping, commissions, advertising, returns, and FBA/storage. The standing desk’s problem becomes obvious immediately: shipping and FBA/storage alone total $90.
After using the list regularly, several features prove convenient:
- Products calculated in the Profit Calculator can be saved with one click, so you do not have to re-enter the parameters. Existing product-selection sheets can also be imported in batches using an Excel template, with up to 500 rows per import.
- You can change each product’s status, add tags such as “Sampled,” “Few Competitors,” or “Filter Replacement Purchases,” and then filter or sort by category, status, or profit margin.
- When you adjust the target profit margin, each product’s gap from the target is recalculated automatically.
- You can use the tool without logging in, and the data is stored locally in your browser. After logging in, you can create groups and sync data across devices.
One Last Point
This year’s peak-season fee table has not changed, but the room left in each order has. Putting candidate products into one list and ranking them using the same assumptions will not take an entire afternoon. Doing it before the inbound deadline is far easier than recalculating everything from an inventory report in January.
Sources and Calculation Notes
- 2026 holiday-season peak fulfillment fee period, average per-unit increase, and inbound deadlines: Chain Store Age, PPC Land
- Effective date of the 3.5% fuel and logistics surcharge: InventoryHero (citing Amazon’s 2026 holiday-season announcement in Seller Central)
- The sample data in this article comes from the built-in demo data in Niceggie’s Procurement List and is for illustration only.
Use the latest announcements in Amazon Seller Central as the reference for fees and deadlines. Actual costs may vary by marketplace, size tier, and inbound method.